RSL
High Frequency Aliasing


return to main index


Introduction

Images produced by a shader that create repeating patterns tend to show a defect known as spatial aliasing. The defect is especially noticable with regular patterns. For example, suppose a displacement shader uses the sin() function to create regular waves on a simple polygon. As the image on the right shows, at low frequency ie. few crests and valleys, the shader works as expected.
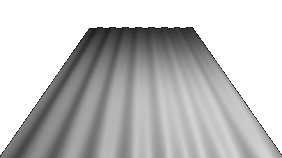

Figure 1 - Low Frequency Pattern


However, as shown in figure 2, once the frequency of the sine waves reaches a certain magnitude an objectionable aliasing occurs.
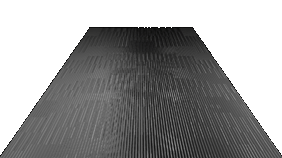

Figure 2 - High Frequency Pattern and Spatial Aliasing


What makes the problem even worse is that the defects flicker during an animation. In other words the high frequency pattern is not only causing spatial aliasing it is also causing temporal aliasing as well.
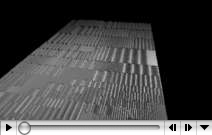
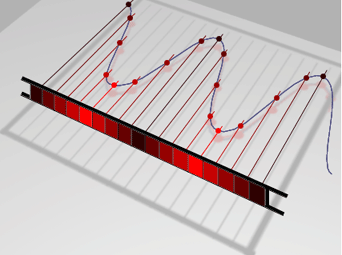
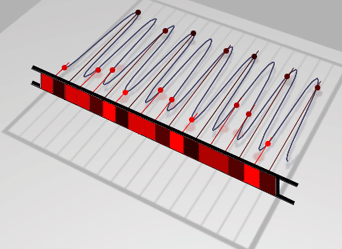
Figure 3 - Temporal Aliasing


Sampling I

A rendered image, like any other computer image, is composed of pixels that form a regular grid. However, unlike an image that has been painted by a human, an image rendered from a 3D scene consists of pixels that have been assigned their colors that a renderer considers will (faithfully) represent the appearance of each visible part of a 3D object.


Figure 4


To understand why a high frequency pattern gives rise to aliasing we must take a close look at a row of pixels to determine where on the surface of an object each pixel is getting its color information.

For example, the pictorial view on the right shows a row of 17 pixels - each of which has been color coded according to the part of the wavy surface the pixel is sampling. As you can see, the sampling is occuring frequently enough for the pixels to show a reasonably smooth color gradation.


Sampling II

The illustration on the right shows what happens when the pixels are not sampling the wavy pattern often enough. Instead of displaying a smooth gradation of color values, the pixels have a "blocky" appearance.


Figure 5


For comparison, the pixels from this and the previous diagram are shown below.


side_by_side1
Figure 6 - High Sampling Rate

side_by_side2
Figure 7 - Low Sampling Rate


As the following diagram shows, an inadequate sampling rate has not only changed the shape of the pattern it has also effectively lowered its frequency from 10 cycles to 7 cycles.


plus_equals
Figure 8


As long as the sampling rate is equal to, or higher, than twice the frequency of the pattern the resulting image will be free of aliasing in the sense that the frequency of the original pattern will be "preserved". The 2 to 1 ratio of sampling to frequency is known as the Nyquist limit. It is this relationship that enables the 44.1khz sampling rate of audio CD's to to reconstruct the high frequency sounds that, in theory, we are capable of hearing.


© 2002- Malcolm Kesson. All rights reserved.