Introduction
The mtor plugin enables Maya curves to be rendered with prman. mtor identifies
a Maya curve as one that should be rendered if it has been assigned an
attribute called mtorCurveWidth. The mtorCurveWidth
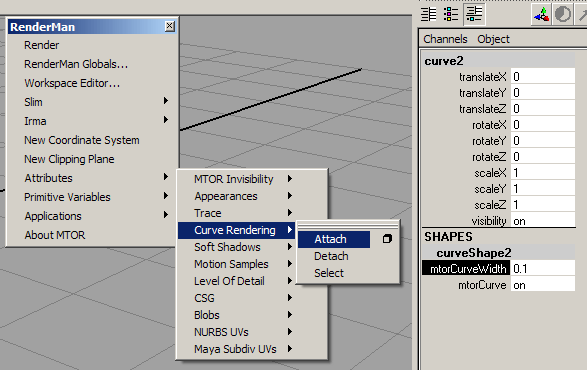
attribute can be assigned via the MTOR->Attribute->Curve Rendering menu (figure 1).
It is often convenient, especially if a number of curves have been created
with a MEL script, to assign the mtorCurveWidth attribute from
the same script that produced the curves. This tutorial demonstrates how to
output Maya curves to prman using MEL scripting.
Adding an Attribute
Lets add the mtorCurveWidth attribute to a very simple (degree 1) Maya curve consisting of a straight line segment.
curve -d 1 -p 0 0 0 -p 0 1 0;
mtorCurveWidth must be added to the shape node of a curve. The curve command returns the name of its parent transformation node. To assign the mtorCurveWidth attribute we must querry the transformation node for the name of its child (curve) shape node ie.
string $shape[] = `listRelatives -s`;
The -s flag means "list the shape nodes". Once the name of the shape node has been obtained, the curve width can be assigned using the MEL addAttr command eg.
addAttr -ln mtorCurveWidth -dv 0.2 -k true $shape[0];
The meaning of the flags are:
-ln "long name"
-dv "default value"
-k "keyable"
Putting these statements together into a simple MEL script we have,
curve -d 1  -p 0 0 0 -p 0 1 0;
string $shape[] = `listRelatives -s`;
addAttr -ln mtorCurveWidth -dv 0.2  -k true $shape[0];
mtor RenderSpool;   // get MTOR to render the scene using prman

Figure 1


